The BACnet Browser in Visual BACnet allows you to customize the information you see and isolate the specific packets you need to solve your problem. It’s one of the most powerful features in Visual BACnet, but an often confused or overlooked one.
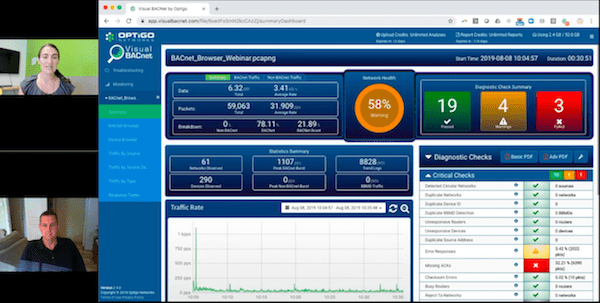
In this 10-minute webinar, we showed attendees how to navigate the BACnet Browser and solve common network problems. Watch the webinar, and read on for our favorite ways to leverage the Browser.

You can access the BACnet Browser on the left side of the Visual BACnet dashboard, right under the Summary option.
Our presenter mentioned that she likens the Browser functionality to Wireshark filters. At its core, this dashboard is a super intuitive and easy version of Wireshark filtering. You can get a lot of this information if you know how to really filter and isolate data in Wireshark. We like the ease and simplicity of drilling down with a handful of clicks.
Here are some of the ways you can use the Browser on your own file. Clicking on each category provides vital information on all the packets that were sent, organized by source, destination, service choice, and on.
- Source: This filter shows which device sent a packet during this capture, and with what frequency.
- Destination: The filter here displays which device received a packet during this capture, and with what frequency.
- Service Choice: This drill-down determines what types of traffic are most common on the site.
- PDU Type: This filter looks at the packet type, whether that’s a Confirm Request, Complex ACK, an Unconfirmed Request, or something else. You likely won’t look at this initially, but it comes in very handy as you pull out more information.
- Vendor: The Vendor drill-down captures the Vendor ID in every packet sent on the network. If the Vendor ID isn’t included in a packet, it will show up as N/A on this drill-down. This way, you know how many vendors you have on-site, you know who to call for tech support, and you can say “I have five of your devices and they’re causing a broadcast storm. How can you fix that?”
- UDP Port: The UDP Port drill-down looks at how segmented the site is, and whether a particular UDP Port is completely overloaded.
- SNET: The SNET looks at the Source Network, so the network that the packet was sent from.
- DNET: The DNET, conversely, looks at the Destination Network, so the network that the packet was sent.
- SNET/SADR: This is the combination of the Source Network and the Source Address, which should be a unique combination with every device on your site.
- Show Frames: This button allows you to dig into the packet frames, much as you would in Wireshark, so you can go frame by frame to narrow in on an issue. You would likely use this view after you’ve filtered down with a few different drill-downs, so you’re not looking at all the frames in your capture.
After we walked through the different tools in the BACnet Browser toolbox, we looked into how you might filter your own files to pinpoint device issues. This is why the BACnet Browser is the definition of working smarter, not harder. Check out our tutorial at 7:25–10:12, and our example of investigating a fresh new file with the BACnet Browser at 10:12–12:03.